Quantower is a fast, modern and powerful trading platform developed by Quantower company. The platform combines the best charting and analytical functionality which gives professional traders more ways to reach the right trading decisions on different markets: Forex/CFDs, Stocks, Futures, Options, ETFs.
Key Benefits & Features:
✔ simultaneous connections to different brokers & data providers
✔ Futures, Stocks, Forex, CFDs, Options, Indices, ETFs trading
✔ 10+ chart types and styles – Time charts, Ticks, Kagi, Renko, Point & Figure, Linebreak, Range, Volume, Candles, Bars.
✔ Volume Analysis tools – Volume profile, Cluster chart (Footprint), Time Statistics, Time histogram, Historical T&S
✔ VWAP and Custom VWAP (anchor VWAP)
✔ Power Trades Tool shows the execution of a large number of orders in a very short time
✔ Options Analytics panel for creating & analyzing Options Strategies, Risk profiles and Volatility Skew.
✔ DOM Surface panel shows changes of all limit orders in Order Book, their placing, modifying, canceling and execution. It allows you to see the intentions of large traders regarding the future price, high liquidity price levels.
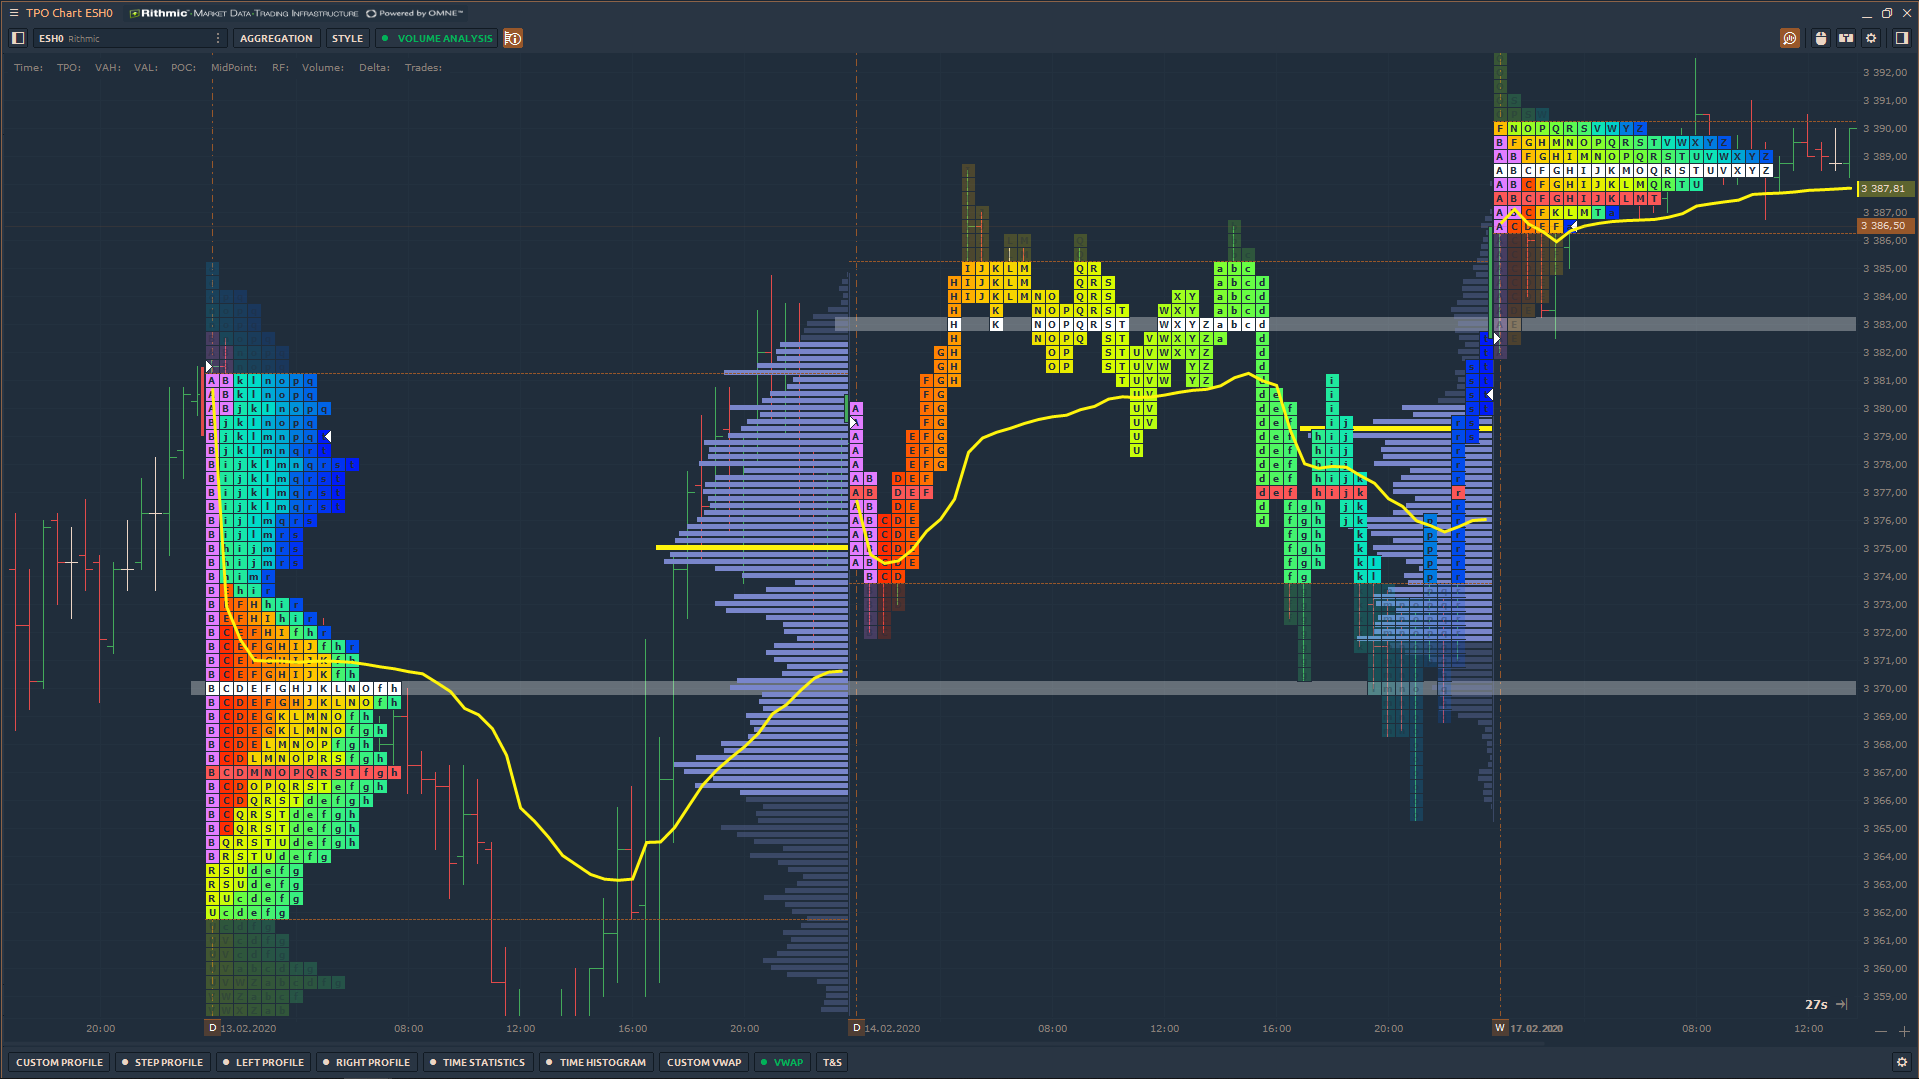
✔ TPO Profile Chart shows the price distribution during the specified time
✔ one-click trading via Chart and DOM Trader panels
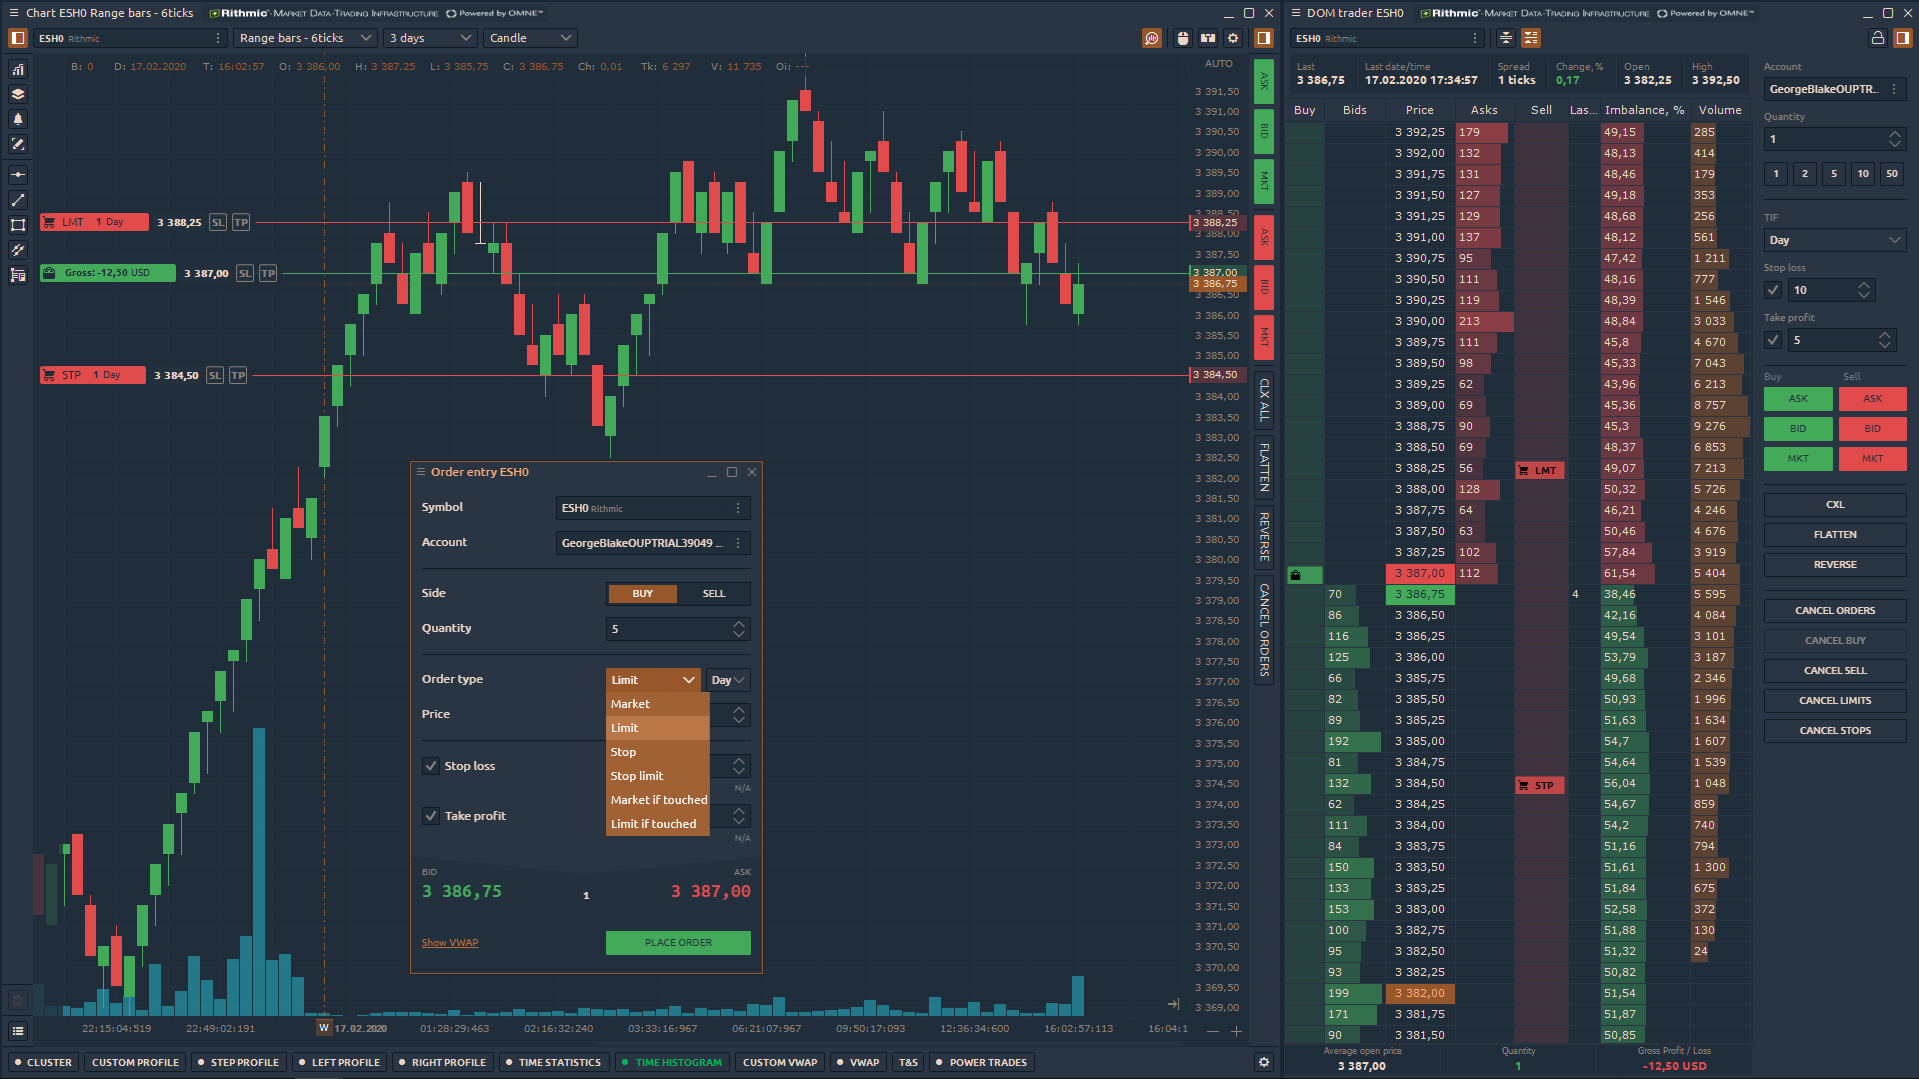
✔ various order types – Market, Limit, Stop, Brackets etc.
✔ panel for simulating of real-time trading on any trading or quoting connections
✔ creating & trading of Spreads and Synthetic Instruments
✔ manual & automative backtesting of trading strategies
✔ creating algorithmic strategies via Quantower Algo
✔ full customization of trading workspaces, panels, templates
Fully customizable and professional interface
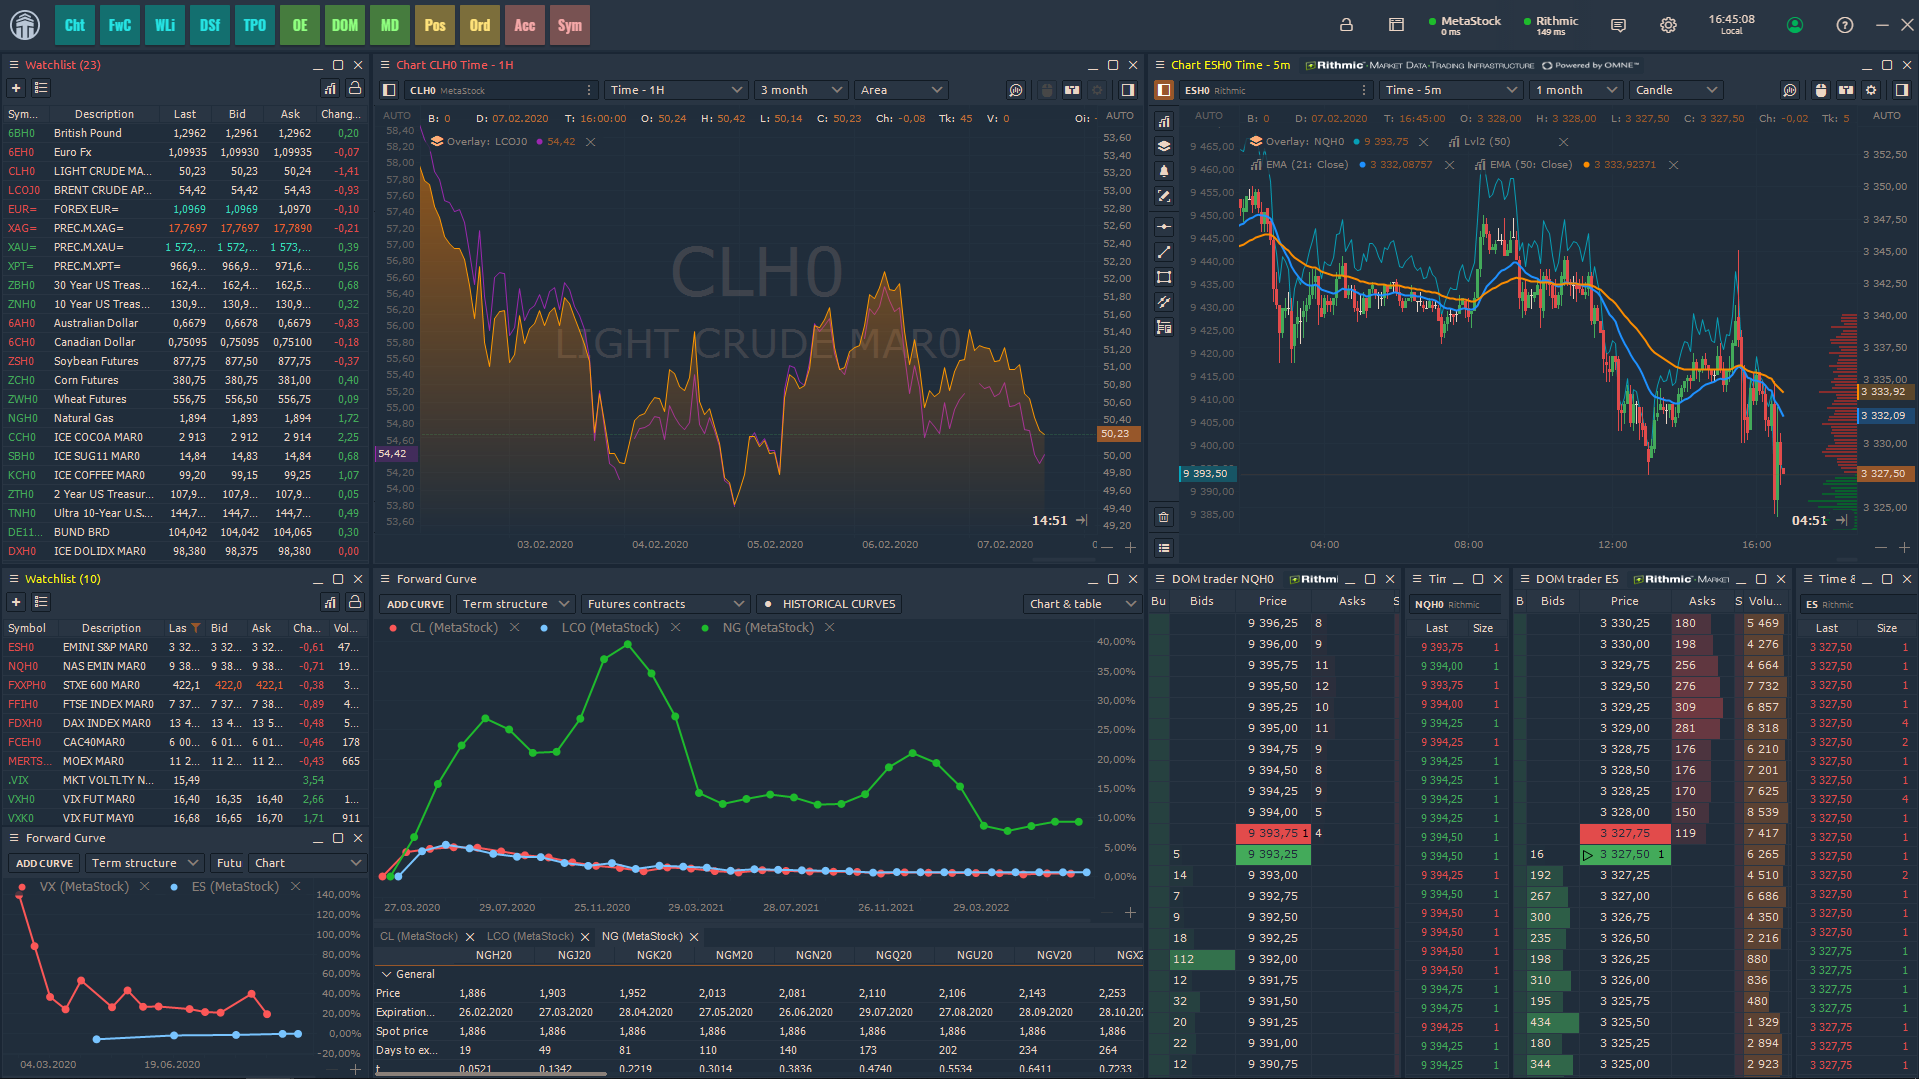
Quantower user-friendly interface allows trader to customize each single panel settings as well as the whole workspace entirely. Any user can easily create trading layout according to the special requirements or wishes using a wide range of options and preferences.
- Flexible visual settings for any panels
- Groups allow nesting several panels into one
- Bind option allowing to combine several panels in one entity.
- Templates allow to save any customized panel, Group or Bind and invoke them later in one click.
Quantower allows creating as many workspaces as you want. Manage and switch over them with one click. As well you can detach necessary panels on another monitor and manage by workspace lists.
Charts, Indicators & Drawings
Quantower offers a large number of standard and advanced chart types, which allow analyzing markets from different sides. So using our trading platform, traders can select:
- Time-based and Tick charts
- Point & Figure, Heikin Ashi, Line Break, Volume
- Renko, Kagi, Range Bars, Footprint (Cluster Chart) with Imbalance
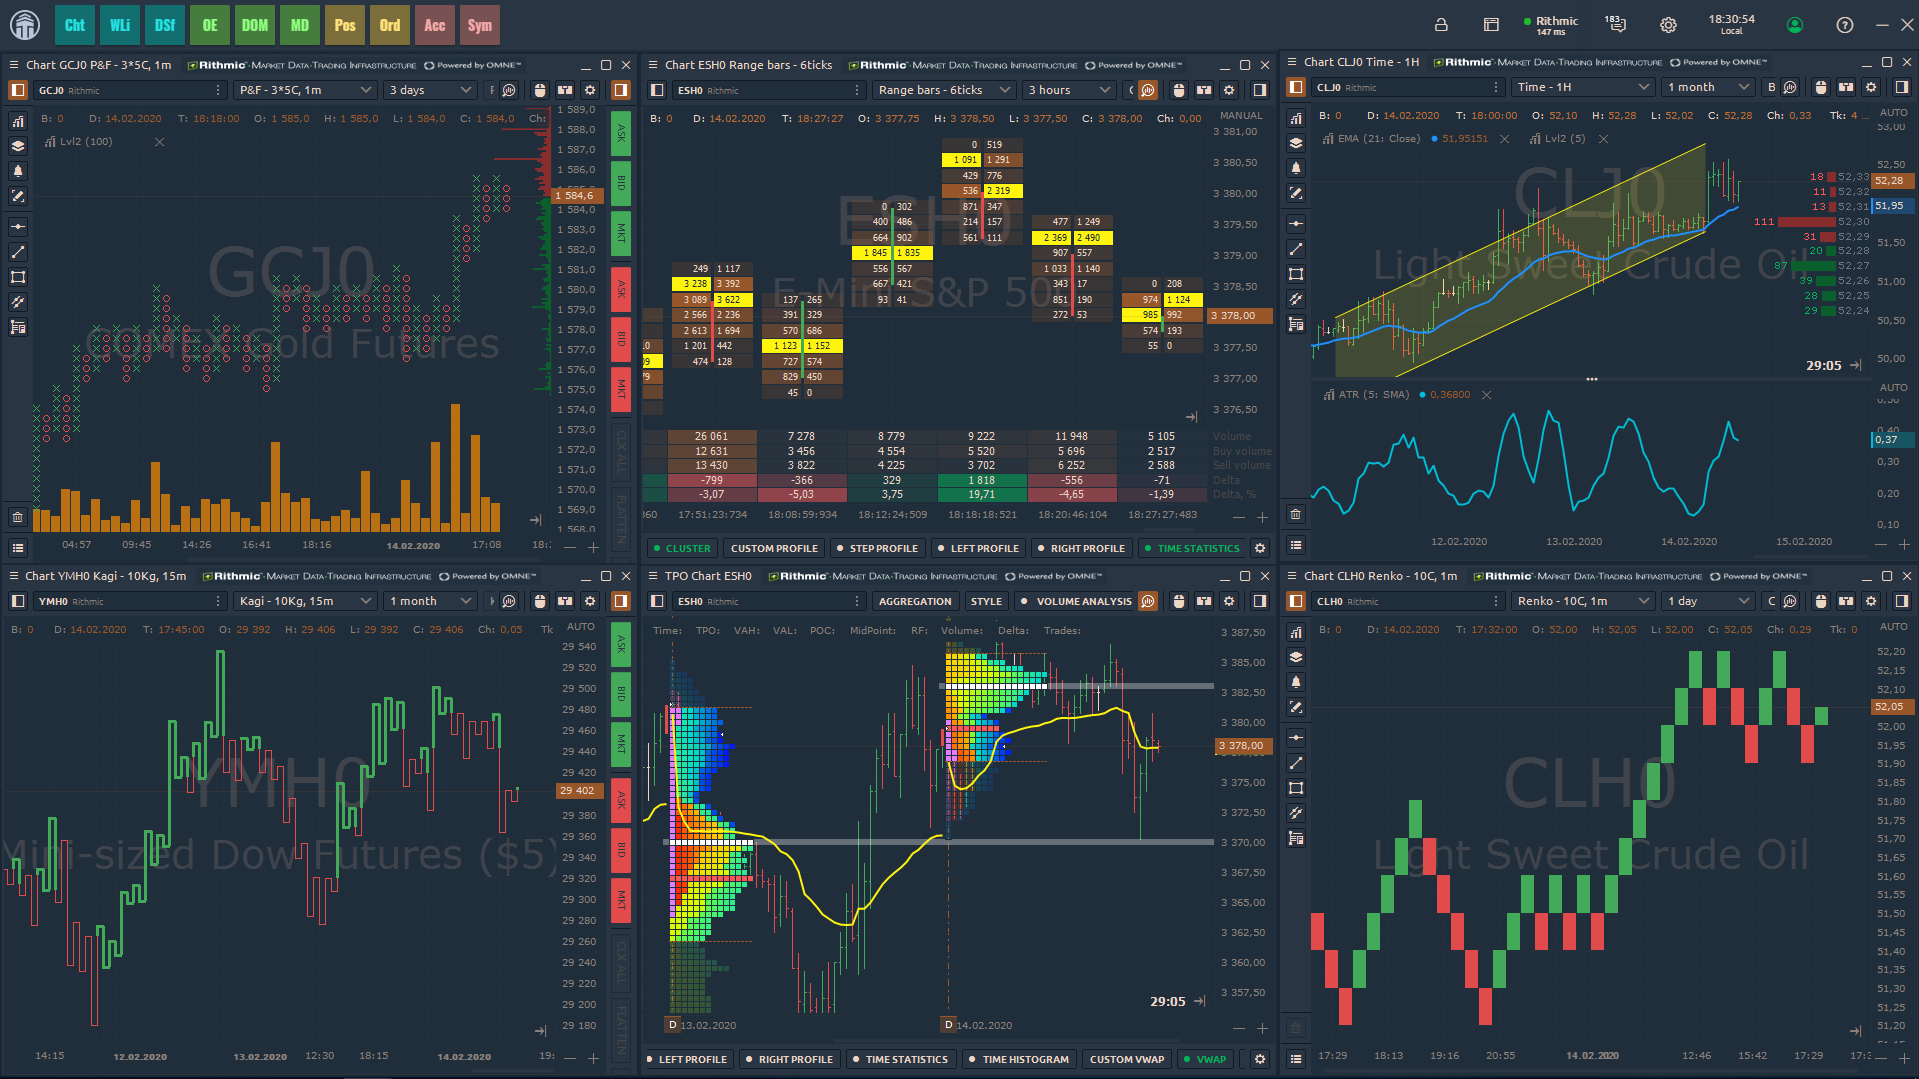
As well Quantower represents several ways of chart styles — candles, bars, line, area, dotted line. With the Timeframe selector, traders can easily switch over various predefined chart types, time periods or create custom intervals and save them as Favorite by pressing Star icon.
A set of 40+ drawing tools allow you to focus on trends, support and resistance, gaps, pivots, and other price patterns. Trend lines & channels, Gartley patterns, Fibonacci and Gann tools, and other drawings can be easily drawn in one click. For quick access to any drawing, it is enough to put them on the side panel, after activating the Star icon next to them.
The platform offers more than 50+ technical indicators which are divided into 6 categories — Channels, Moving Averages, Trend, Oscillators, Volatility, Volume indicators
Volume Analysis Tools — Volume Profile, Cluster chart, Time Statistics and more
Quantower provides traders with a variety of advanced volume analyses features. It allows you to see the traded volume at each price level, assesses the balance between buyers and sellers and understands the intentions of traders regarding the future price.
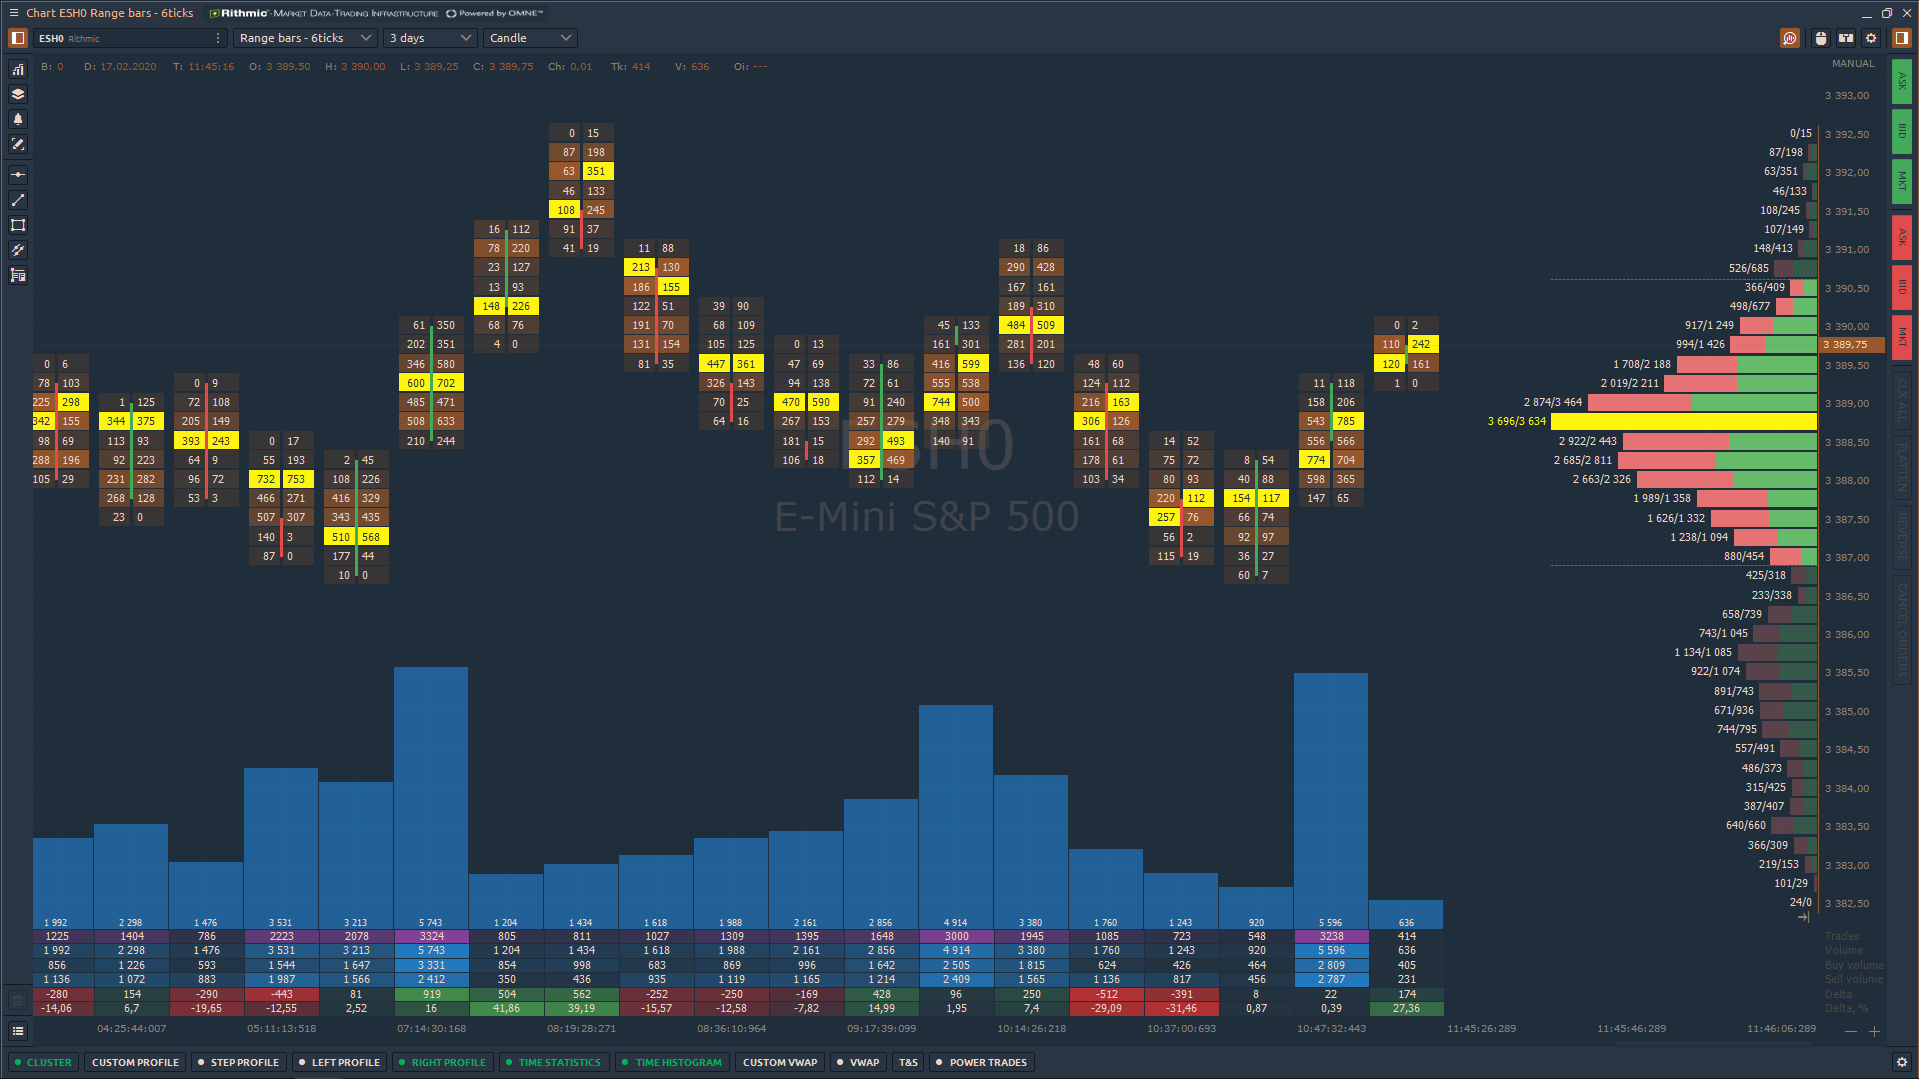
- Cluster chart combines several important characteristics like time, OHLC prices, trading volume, number of buy and sell trades. Imbalance mode shows price levels where buy volume is excess over sell volume.
- Volume Profile displays the trading activity over a specific time period at certain price levels. This allows you to more accurately see the zones of maximum trading interest, and as a consequence, the “true” support/resistance levels.
- Time Statistics shows extended volume statistics for each individual bar — Total volume, Trades, Buy and Sell volume, Delta, as well as custom filters.
TPO Profile Chart
Time Price Opportunity or TPO Chart, shows the price distribution during the specified time, thus forming a profile. This allows you to understand at which levels or ranges the price has spent the most time, as well as to determine the main support and resistance levels.
Trading functionality
Depending on the connected data provider or broker, the platform supports various order types, including Market, Limit, Stop, OCO orders, Brackets. At the same time, orders have different time restrictions which set how it will behave during the trading session.
Quantower provides several options for placing orders for maximum efficiency:
- Chart trading — quick order placement and modification in one-click
- Order Entry — allows you to configure all the order’s parameters before sending it to the order book
- DOM Trader panel — place a resting or aggressive order directly in price ladder. You can place bracket orders or OCO.
- DOM Surface panel — analyze historical limit order book and place your orders on the strongest levels
- FX Cell — monitor quotes and submit a market order by bid or ask price in a single click
Trading Simulation and Manual Backtesting
Quantower provides a Trading simulator or Market Replay Mode, an excellent trading tool that allows emulating the execution of orders under any connection, including those that do not allow trading. An exceptional feature of the panel is that you can practice your trading without risking your money in real-time.

For traders who are not experienced in developing of algorithmic strategies, Quantower team has created a module for manual backtesting called History Player.
Trade options with Option Analytics panel
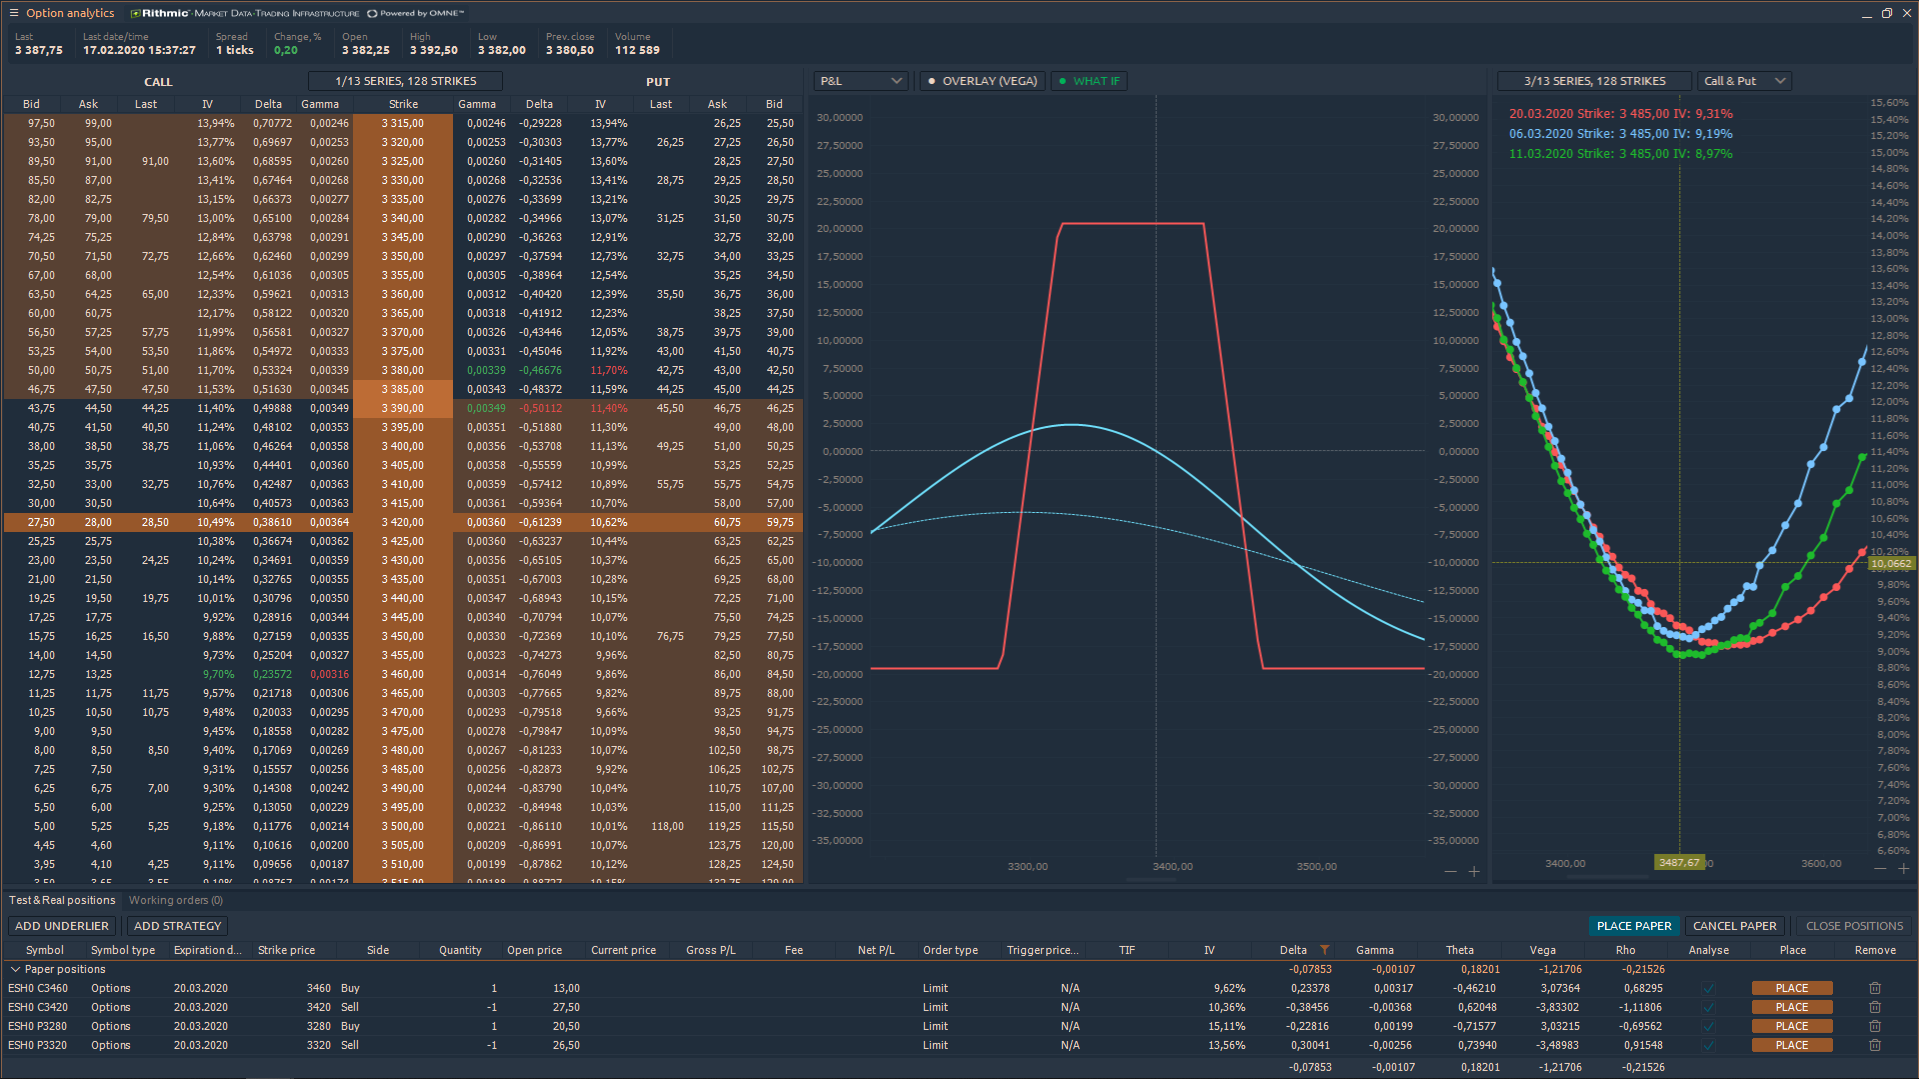
— Joint mode of Option Desk & Analyzer & Volatility Smile
Add Paper positions in the options desk and the strategy analyzer will immediately show the option profile. This mode will allow you to see all changes in options desk — prices, volatility, options Greek values — and option profiles on one screen.
— Overlays
Use the overlay functionality for a versatile analysis of the position, when creating options strategies. In addition to the P & L, you can add Delta, Theta, Gamma, Vega, Rho. Thus, you simultaneously see changes not only for the options risk profile but also for other portfolio parameters.
— What-if Scenario analysis
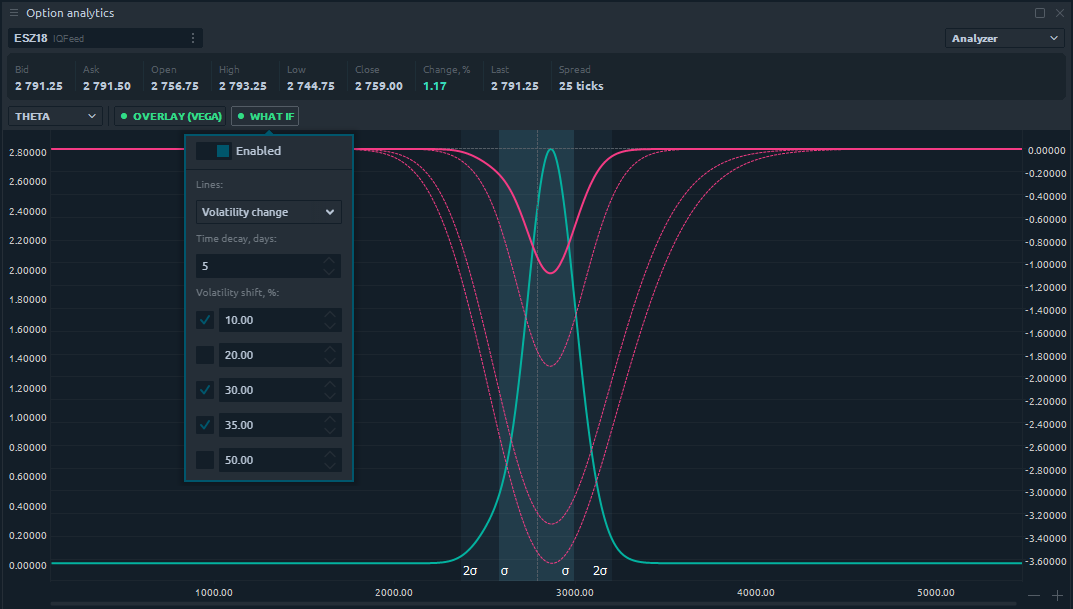
Assess the impact of volatility and time decay on the options trading strategy using What-if analysis.
DOM Surface panel
Using the DOM Surface panel, a trader sees all changes of limit orders in the Order Book (depending on the depth of market data), which is presented as a Heatmap. The panel shows the placement of limit orders, their changing, canceling or execution by large market participants, as well as the imbalance between buyers and sellers.
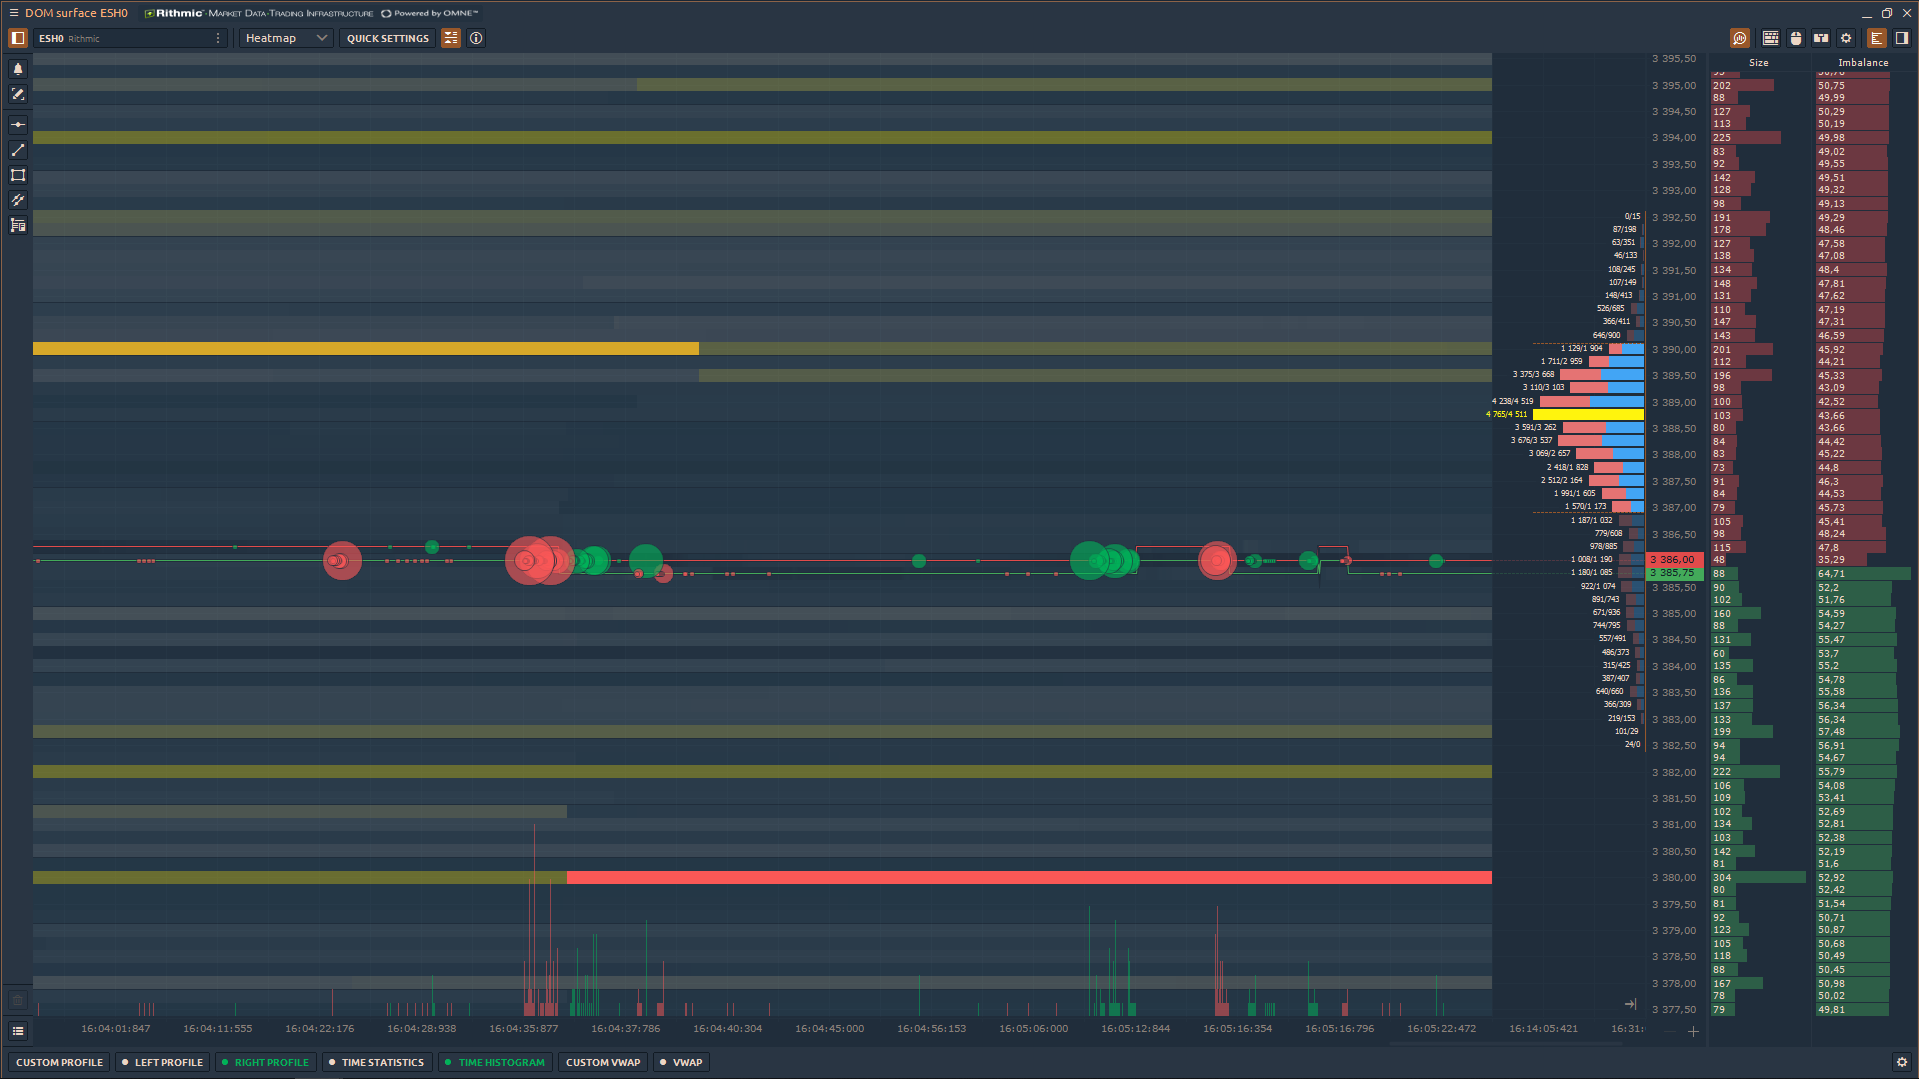
Unlike other types of charts, such as Footprint (or Cluster chart), the DOM Surface shows not only aggressive market orders but also limit orders, which have a greater influence on the price behavior.
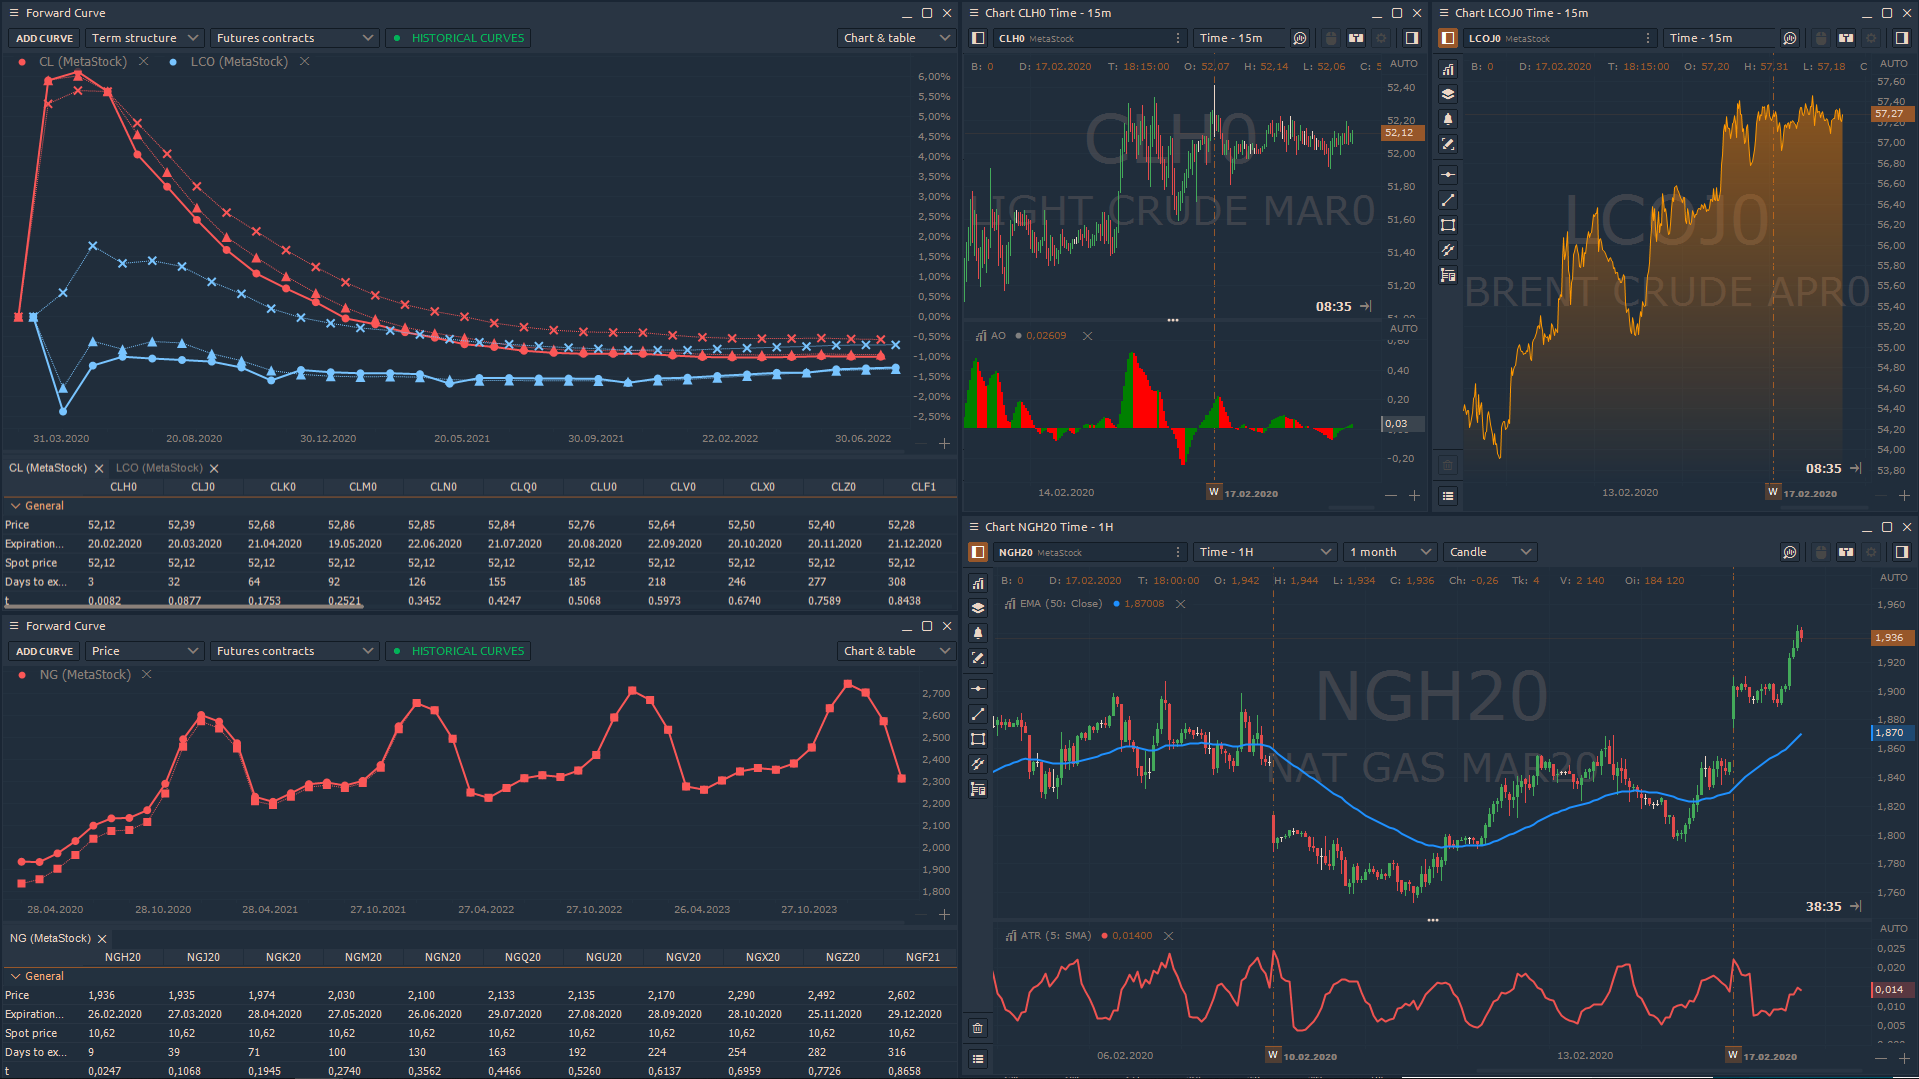
Forward Curve panel
Forward Curve is the plotting of the current price for each futures contracts on commodity on a single curve. By changing to the Term Structure, you will see the ratio of all contracts to the current.
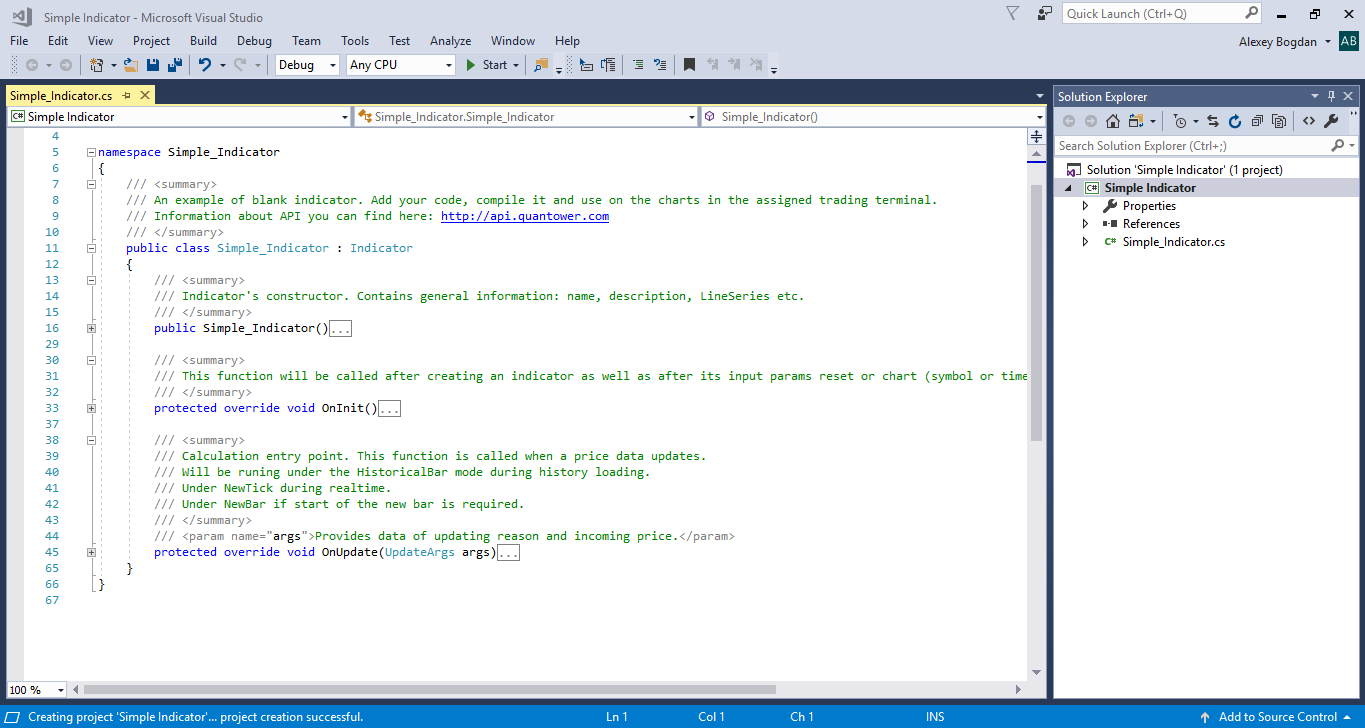
Quantower Algo solutions
Quantower provides a set of solutions for creating custom modules for the trading platform. Besides standards, such as automatic strategies (trading robots) and indicators, you can create your plugins and even connectors to brokers or exchanges.
We are proposing to use popular and, at the same time, simple language — C# with integrations with major IDE’s instead. At the moment, an extension for Visual Studio is available on the marketplace.
Additional features
In addition to a wide set of “must-have” functionality, Quantower proposes an impressive list of complimentary plugins and this list is constantly growing. Among those, who attract the most attention:
Exchange Times — to quickly determine which exchanges are currently running;
Market heat map — building a heat map from a specified set of symbols using Change or Volume value;
History exporter — for exporting history from any symbols and connections with multitasking support.
Stat Matrix — shows the correlation between different assets (instruments)
Symbol Mapping — allows you to create a connection between different date feeds and trading connections.
Alerts Log — collects all alerts that come from different panels, such as Chart, Watchlist etc.