 |
Overcharts is a fast, intuitive, professional, multiple data-feeds technical analysis and trading platform, designed by traders for traders. Overcharts’ mission is to provide traders the best possible trading experience and chart analysis, all in a single platform and at a reasonable price:
- Simple and intuitive platform
- Powerful charting and indicators
- One click trading from chart and DOM
- Professional volume analysis and cluster (Volume Profile, TPO Profile, Volume Ladder, Bubbles, Market Depth Map, VWAP, Delta etc.)
- Advanced charts & quote board
- Custom indicators
- Multiple brokers and multiple streaming real time data-feeds
- Settings saved on Cloud
- Multiple workspaces with multithread technology
- 4K Ultra HD monitor supported
- Technical support
- Video tutorials
Highlights
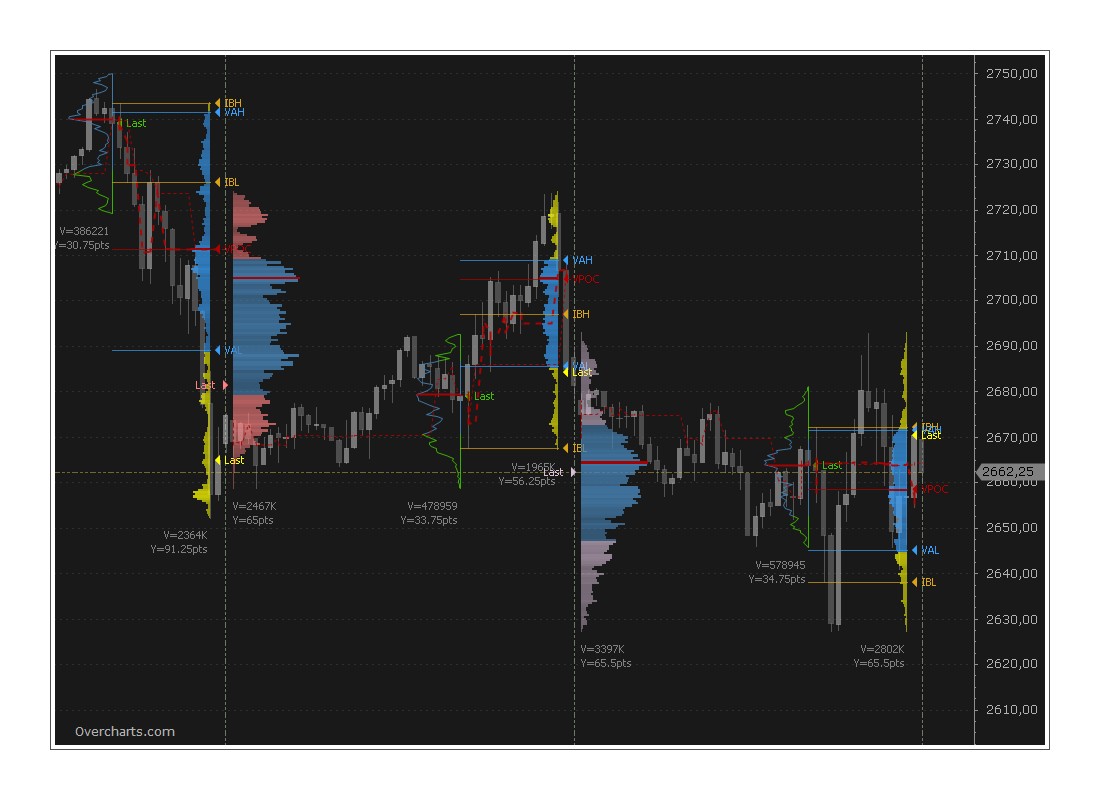
Volume Profile & Tick/Volume AnalysisThe tick/volume analysis includes a package of indicators and tools that are essential to understand market movements in advance.
|
 |
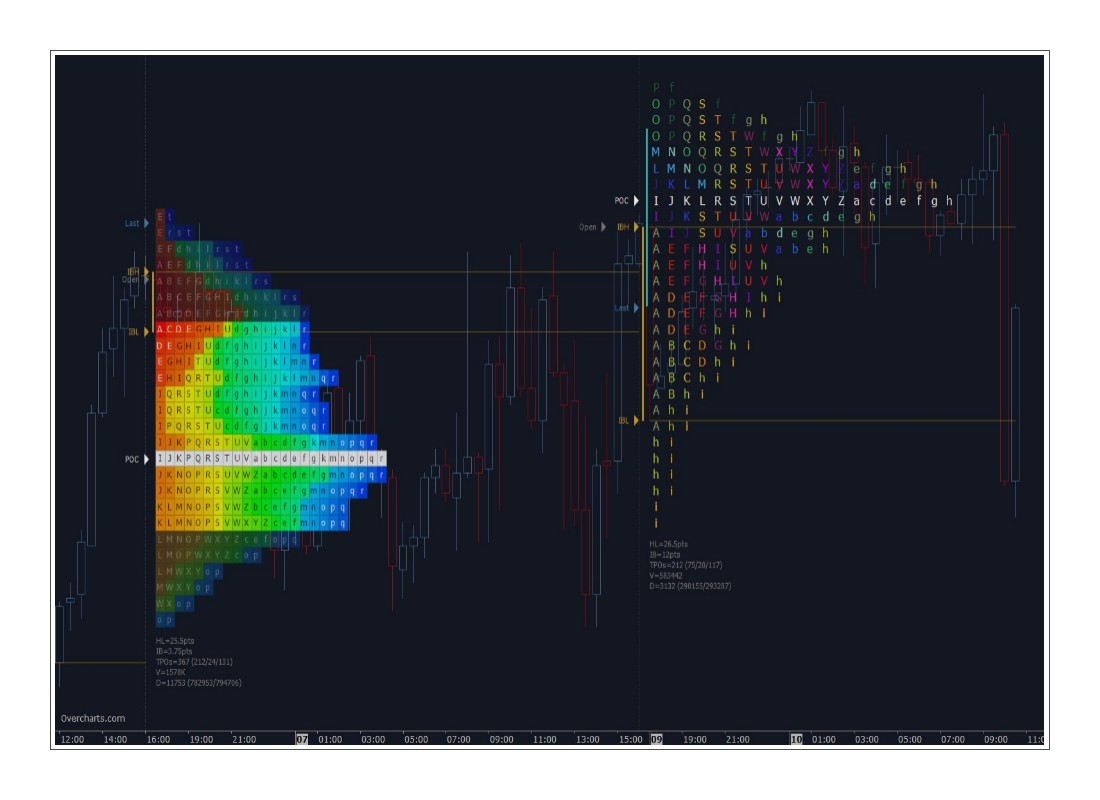 |
TPO Profile
TPO Profile is similar to volume profile. Time-Price-Opportunity (TPO) shows the price distribution during the specified time and highlights at which levels the price has spent the most time. |
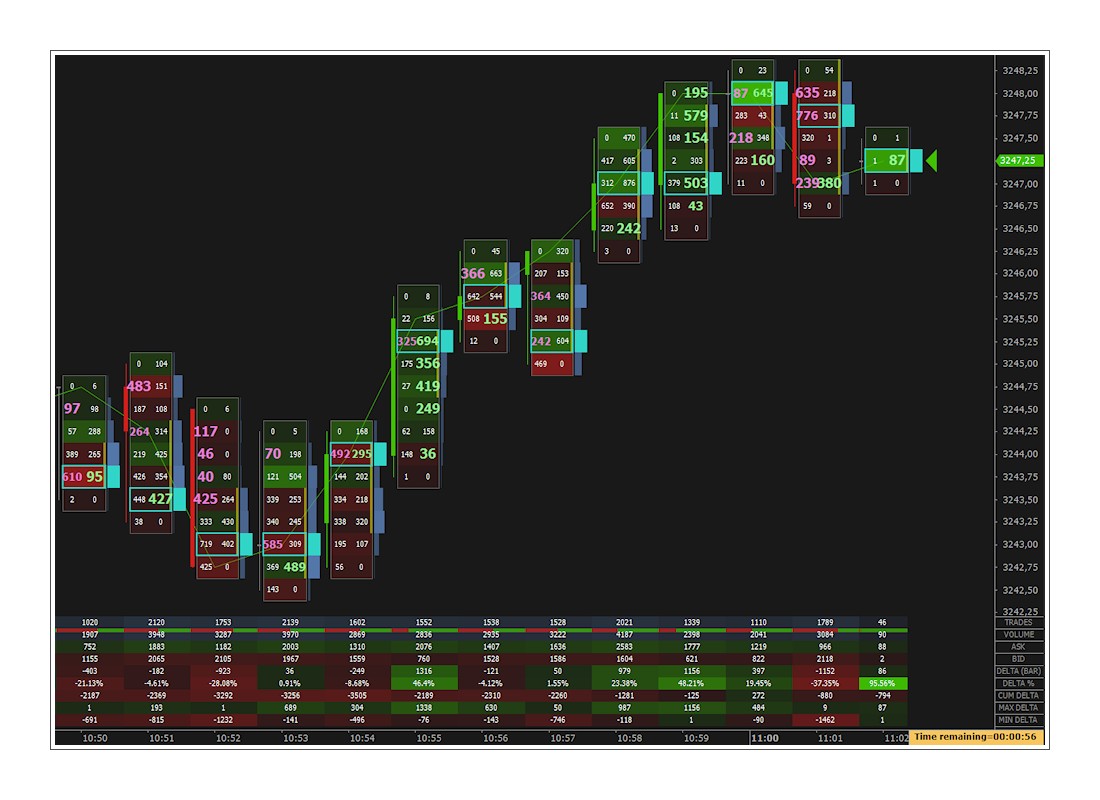
| Volume Ladder
Volume Ladder is one of the most important indicators of order flow analysis. It displays Volume, Bid/Ask, Delta and other volume statistics all together inside of each bar. This allows you to trade faster and more accurately. |
 |
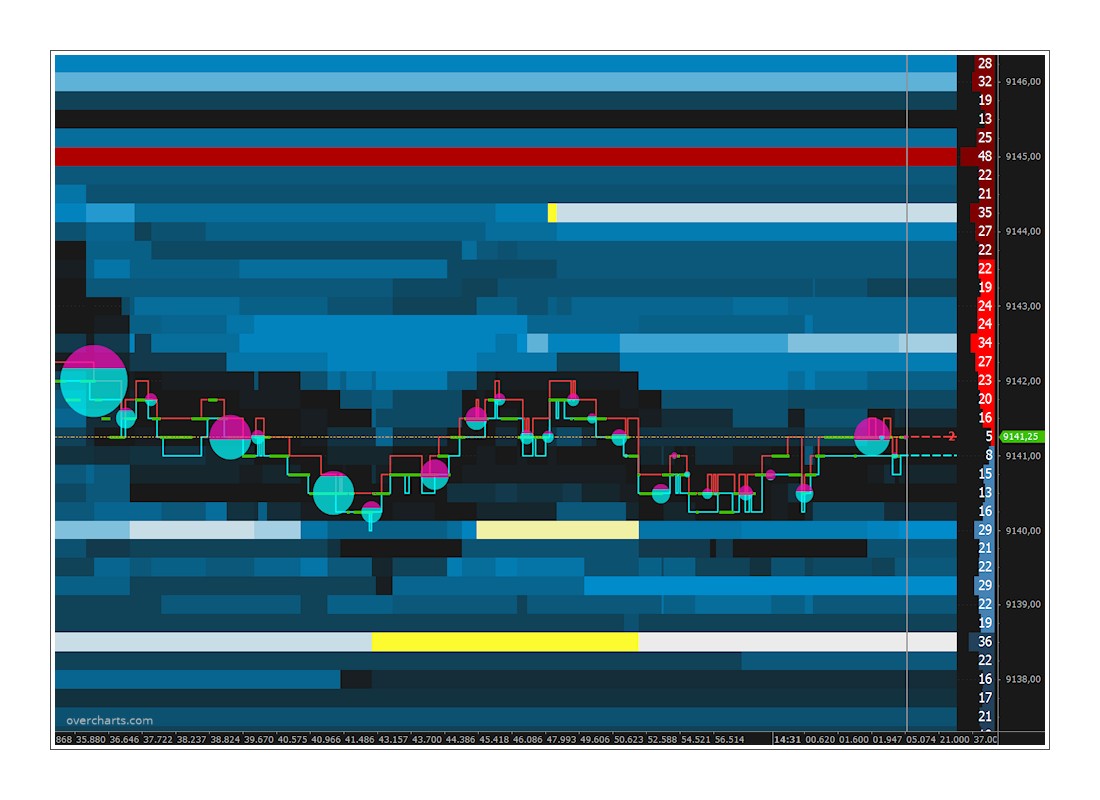 |
Market Depth MapThe Market Depth Map helps traders identify potential levels of support and resistance by analyzing the volumes of limit order book (DOM).
Each price level takes on a different color depending on the volume of corresponding DOM level. The higher the volume, the greater the intensity of color and, the greater the intensity of color, the higher the probability of identifying a support or resistance. |
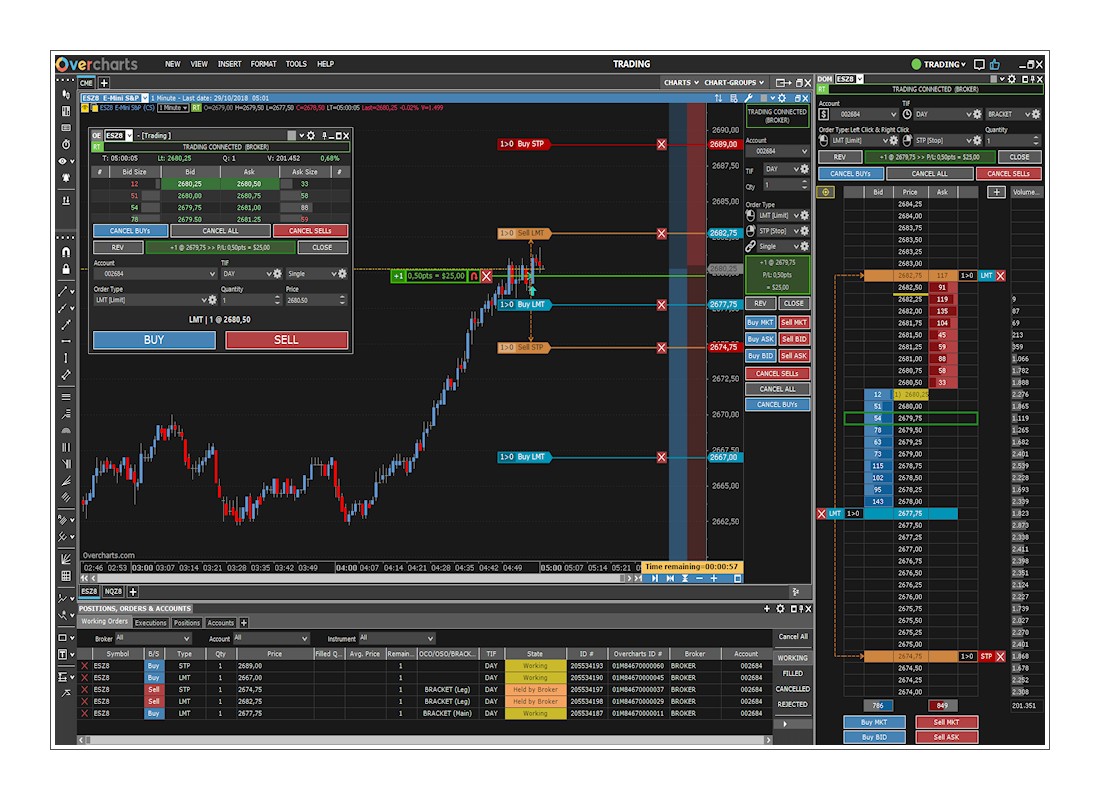
Integrated DOM & Chart TradingTrading from CHART or DOM? No matter! It is the same. Just one click. Overcharts offers a wide range of order types. Single: Market, Limit, Stop, Stop Limit, Trailing stop, Trailing stop limit, Iceberg, etc. Linked: OCO (Order-Cancels-Order), OSO (Order-Sends-Order), BRACKET (with Target & Stop loss). |
 |
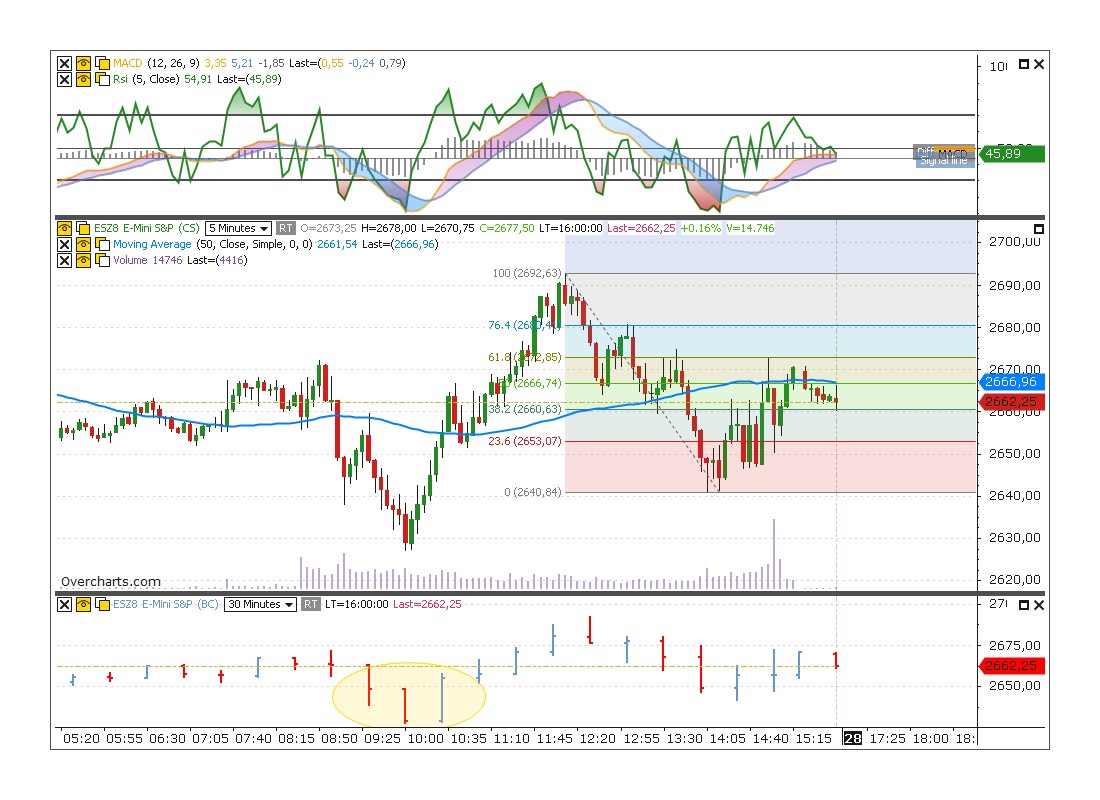 |
Chart Analysis
With a 4k Ultra-HD graphics engine, Overcharts offers the ability to make the clearest and most immersive trading experience ever. Analyze the market with many different types of charts, such as Candlestick, Bar, Line, Equivolume, Candlevolume, Point & Figure, Kagi, Renko, Three Line Break, Heikin Ashi, Dot on Close, Volume Bar, Range Bar, Reversal Bar, Candle Hollow and more. Overcharts also has all common indicators available that can be plotted on the charts, along with the ability to plot charts of other instruments on top of existing data with any resolution. Each chart (or data series) can display up to 100 million bars on a 64-bit operating system. Advanced Drawing tools are available: Trendline, Fibonacci, Elliott, Pitchfork, numerous Channel types, Measurement tools and many others. |
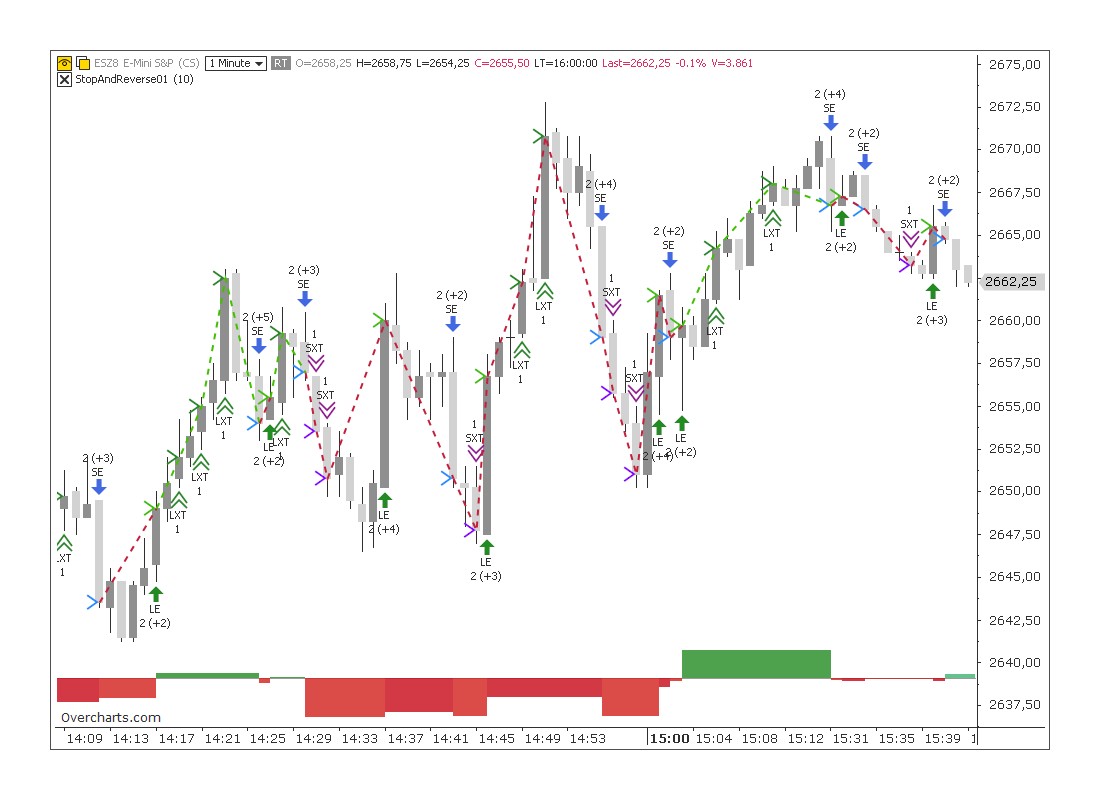
| Trading Strategies & Custom IndicatorsCreate your trading strategies and indicators using OverBasic, a basic style easy language.
Optimize your strategies by performing accurate backtestings and consulting the results in detailed reports. |
 |